
What is the Social Media report?
The Social Media report brings together data from all your organic social channels — Facebook, Instagram, LinkedIn, TikTok, and YouTube — so you can see how your content is performing across platforms in one place.
Note: This report shows organic data (including boosted/promoted posts). For paid-only ad performance, use the Ad Performance page.
Account Summary tab
A high-level overview of your social media performance across all connected accounts:
- Stat cards — Key metrics like impressions, engagement, followers, clicks, and shares
- Trend chart — Your selected metric over time, with options for different chart types and time breakdowns
- Posting frequency — How often you're publishing across channels
Posts tab
See all your posts and their statistics and identify the best performers across channels:
- Post preview (text and image/video thumbnail)
- Platform and account
- Publish date
- Impressions, engagement, clicks, shares, comments, reactions
You can sort by any metric to find your best (or worst) performing content, search for specific posts, and filter by platform or tags.
Click any post to open a detailed view with the full content preview and all metrics.
Note that metrics on the Social Media page include both organic data and data from posts that have been promoted/boosted. If you look at a metric like "Impressions", it includes both organic and paid activity. If you want to investigate your paid ad performance specifically, use the Ad Performance page.
Pages tab
Shows metrics at the account/page level rather than per-post:
- Follower count and growth
- Page impressions and reach
- Engagement rate
- Per-platform breakdown
What does "Paid" mean here?
On the Social Media page, Paid measures ad-driven views of your Page's content — a Page Insights metric reported by the platform (e.g. Facebook). It tells you how much of your organic Page content's visibility was assisted by ads, compared to purely organic reach.
It is not the same as the impressions, reach, or spend shown in your ad platform (e.g. Meta Ads Manager), and the numbers will not match — they measure different things. Use the Ad Performance page to analyse your ad campaigns.
Why can the Account Summary show "Paid", while the "Paid" filter in Posts shows no posts?
This is expected. The two views use different data sources:
- The Account Summary Paid figure comes from a page-level metric for your whole Page. It can be greater than zero even with no boosted posts — for example when ads surface your Page content.
- The Paid filter in Posts only shows individual posts that were boosted/promoted. If you haven't boosted any individual posts, this filter correctly returns nothing.
In short: Paid in the Account Summary with an empty Posts "Paid" filter means your Page had ad-driven visibility that didn't come from boosting specific posts.
Filters
- Date range — Any period with optional comparison
- Resources — Filter to specific social accounts
- Tags — Filter posts by your custom tags
- Search — Find posts by content
- Metric filters — Show only posts above/below a metric threshold (e.g. engagement > 100)
Tagging posts
Select one or more posts and assign tags to organize your content — for example, tag campaign posts, product launches, or seasonal content. Then use tag filters to analyze performance by category.
How do I get data in this report?
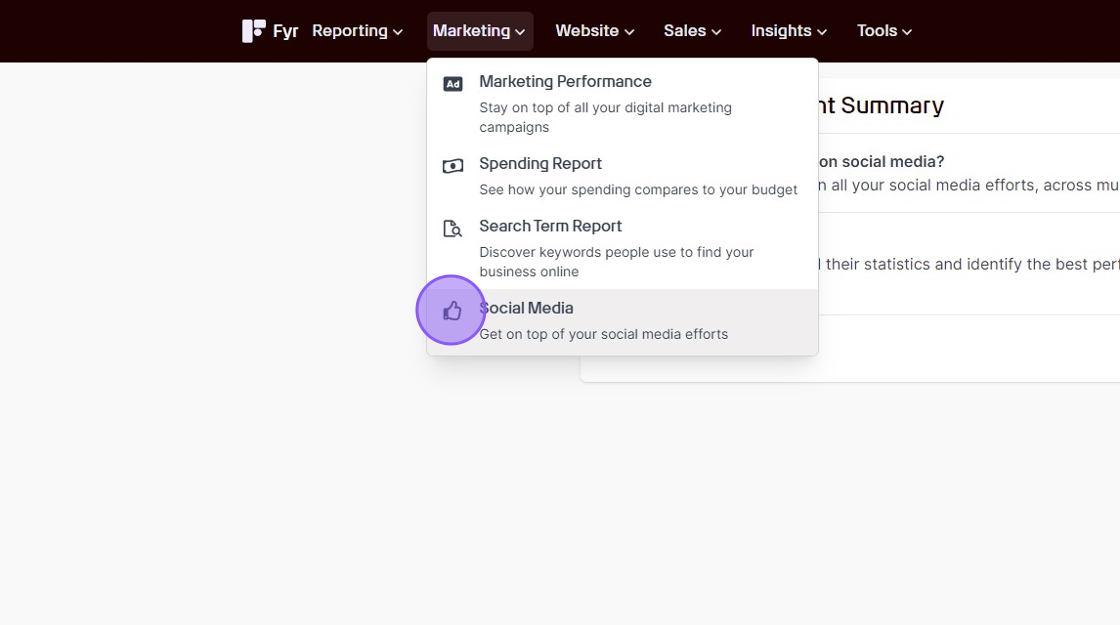
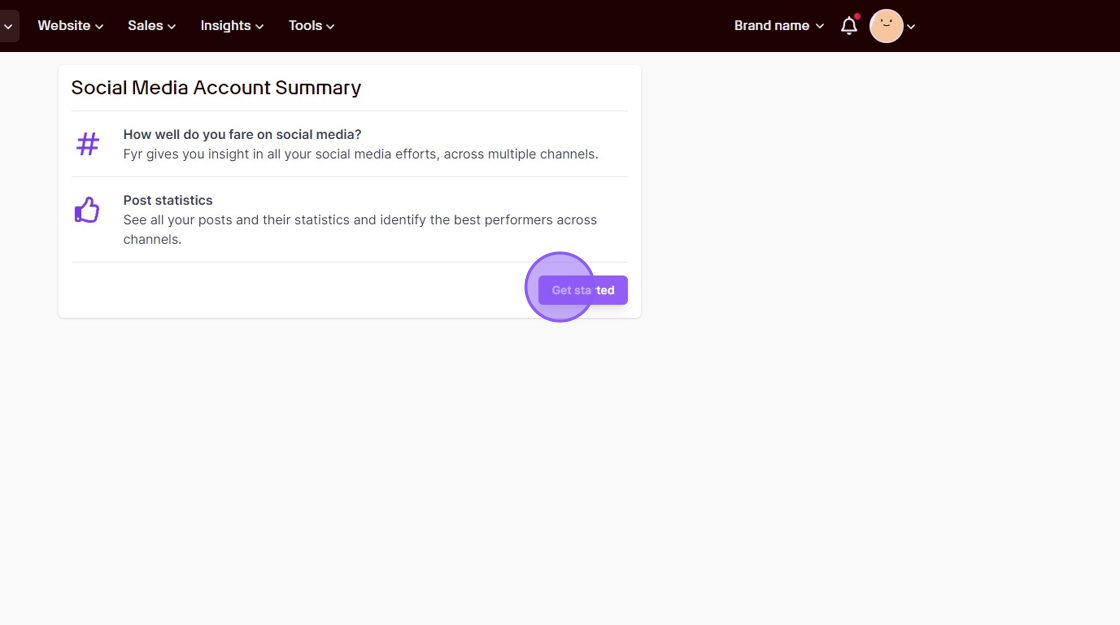
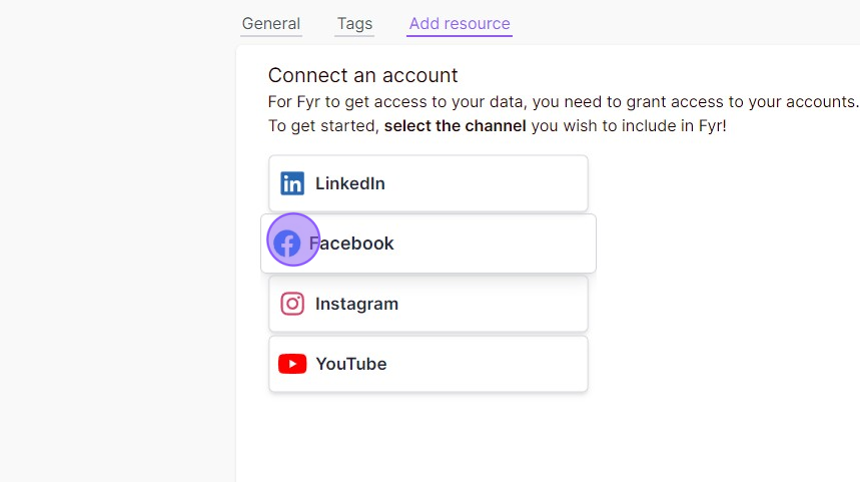
Comments
0 comments
Article is closed for comments.